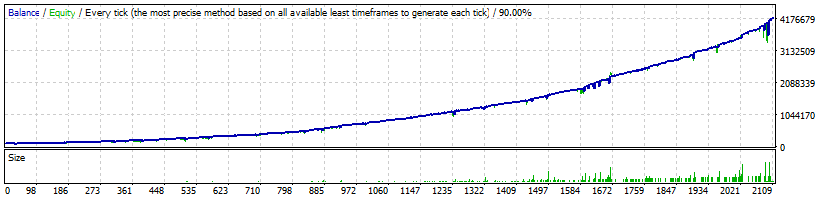
Strategy Tester Report
FXVertex
EGlobal-Demo (Build 1470)
| Symbol | USDJPY (US Dollar vs Japanese Yen) | ||||
| Period | 1 Hour (H1) 2016.01.04 00:02 - 2025.10.24 22:56 (2016.01.01 - 2026.01.01) | ||||
| Model | Every tick (the most precise method based on all available least timeframes) | ||||
| Bars in test | 3653664 | Ticks modelled | 37810073 | Modelling quality | n/a |
| Mismatched charts errors | 0 | ||||
| Initial deposit | 100000.00 | Spread | 30 | ||
| Total net profit | 4089986.01 | Gross profit | 8013369.57 | Gross loss | -3923383.57 |
| Profit factor | 2.04 | Expected payoff | 1942.06 | ||
| Absolute drawdown | 30323.23 | Maximal drawdown | 1408041.66 (34.91%) | Relative drawdown | 34.91% (1408041.66) |
| Total trades | 2106 | Short positions (won %) | 893 (73.46%) | Long positions (won %) | 1213 (75.52%) |
| Profit trades (% of total) | 1572 (74.64%) | Loss trades (% of total) | 534 (25.36%) | ||
| Largest | profit trade | 408834.25 | loss trade | -171737.23 | |
| Average | profit trade | 5097.56 | loss trade | -7347.16 | |
| Maximum | consecutive wins (profit in money) | 27 (46198.72) | consecutive losses (loss in money) | 4 (-184483.25) | |
| Maximal | consecutive profit (count of wins) | 526036.44 (4) | consecutive loss (count of losses) | -387163.41 (3) | |
| Average | consecutive wins | 4 | consecutive losses | 2 | |