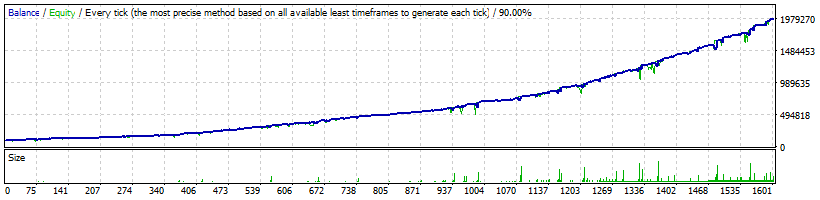
Strategy Tester Report
FXLambda
EGlobal-Demo (Build 1470)
| Symbol | USDJPY (US Dollar vs Japanese Yen) | ||||
| Period | 1 Hour (H1) 2018.01.02 00:01 - 2025.12.31 23:47 (2018.01.01 - 2026.01.01) | ||||
| Model | Every tick (the most precise method based on all available least timeframes) | ||||
| Bars in test | 2978250 | Ticks modelled | 30505756 | Modelling quality | 90.00% |
| Mismatched charts errors | 0 | ||||
| Initial deposit | 100000.00 | Spread | 30 | ||
| Total net profit | 1889820.60 | Gross profit | 3187392.49 | Gross loss | -1297571.89 |
| Profit factor | 2.46 | Expected payoff | 1181.88 | ||
| Absolute drawdown | 18787.88 | Maximal drawdown | 227802.78 (34.37%) | Relative drawdown | 34.37% (227802.78) |
| Total trades | 1599 | Short positions (won %) | 836 (71.65%) | Long positions (won %) | 763 (73.66%) |
| Profit trades (% of total) | 1161 (72.61%) | Loss trades (% of total) | 438 (27.39%) | ||
| Largest | profit trade | 78732.04 | loss trade | -22211.62 | |
| Average | profit trade | 2745.39 | loss trade | -2962.49 | |
| Maximum | consecutive wins (profit in money) | 27 (15520.18) | consecutive losses (loss in money) | 5 (-33219.89) | |
| Maximal | consecutive profit (count of wins) | 138781.14 (7) | consecutive loss (count of losses) | -58286.14 (4) | |
| Average | consecutive wins | 4 | consecutive losses | 2 | |