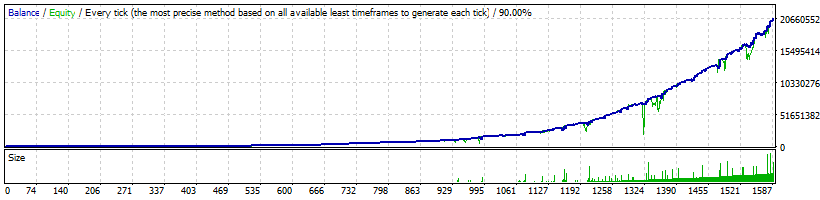
Strategy Tester Report
FXLambda
EGlobal-Demo (Build 1470)
| Symbol | USDJPY (US Dollar vs Japanese Yen) | ||||
| Period | 1 Hour (H1) 2018.01.02 00:01 - 2025.12.31 23:47 (2018.01.01 - 2026.01.01) | ||||
| Model | Every tick (the most precise method based on all available least timeframes) | ||||
| Bars in test | 2978250 | Ticks modelled | 30505756 | Modelling quality | 90.00% |
| Mismatched charts errors | 0 | ||||
| Initial deposit | 100000.00 | Spread | 30 | ||
| Total net profit | 206803470.05 | Gross profit | 332427299.37 | Gross loss | -125623829.32 |
| Profit factor | 2.65 | Expected payoff | 130475.38 | ||
| Absolute drawdown | 63379.00 | Maximal drawdown | 51619179.77 (71.36%) | Relative drawdown | 92.98% (13692628.25) |
| Total trades | 1585 | Short positions (won %) | 827 (72.19%) | Long positions (won %) | 758 (73.88%) |
| Profit trades (% of total) | 1157 (73.00%) | Loss trades (% of total) | 428 (27.00%) | ||
| Largest | profit trade | 9074410.39 | loss trade | -2072870.62 | |
| Average | profit trade | 287318.32 | loss trade | -293513.62 | |
| Maximum | consecutive wins (profit in money) | 27 (606997.88) | consecutive losses (loss in money) | 4 (-3193900.29) | |
| Maximal | consecutive profit (count of wins) | 15431394.86 (7) | consecutive loss (count of losses) | -4483363.47 (3) | |
| Average | consecutive wins | 4 | consecutive losses | 2 | |