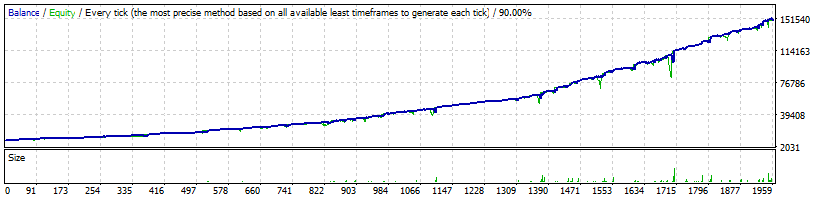
Strategy Tester Report
FXLambda
EGlobal-Demo (Build 1470)
| Symbol | USDCAD (US Dollar vs Canadian Dollar) | ||||
| Period | 1 Hour (H1) 2018.01.02 00:04 - 2025.12.31 23:47 (2018.01.01 - 2026.01.01) | ||||
| Model | Every tick (the most precise method based on all available least timeframes) | ||||
| Bars in test | 2977450 | Ticks modelled | 29110158 | Modelling quality | 90.00% |
| Mismatched charts errors | 0 | ||||
| Initial deposit | 10000.00 | Spread | 30 | ||
| Total net profit | 139799.85 | Gross profit | 241328.51 | Gross loss | -101528.66 |
| Profit factor | 2.38 | Expected payoff | 71.47 | ||
| Absolute drawdown | 2032.12 | Maximal drawdown | 26601.12 (24.46%) | Relative drawdown | 32.82% (15204.23) |
| Total trades | 1956 | Short positions (won %) | 766 (72.85%) | Long positions (won %) | 1190 (72.18%) |
| Profit trades (% of total) | 1417 (72.44%) | Loss trades (% of total) | 539 (27.56%) | ||
| Largest | profit trade | 10354.88 | loss trade | -2486.04 | |
| Average | profit trade | 170.31 | loss trade | -188.36 | |
| Maximum | consecutive wins (profit in money) | 23 (1621.36) | consecutive losses (loss in money) | 9 (-751.63) | |
| Maximal | consecutive profit (count of wins) | 14916.49 (8) | consecutive loss (count of losses) | -9320.07 (6) | |
| Average | consecutive wins | 5 | consecutive losses | 2 | |