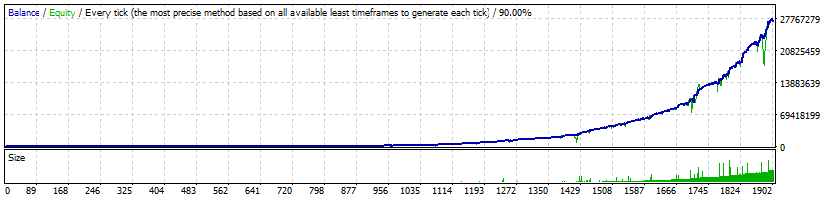
Strategy Tester Report
FXLambda
EGlobal-Demo (Build 1470)
| Symbol | GBPUSD (Great Britain Pound vs US Dollar) | ||||
| Period | 1 Hour (H1) 2018.01.02 00:01 - 2025.12.31 23:47 (2018.01.01 - 2026.01.01) | ||||
| Model | Every tick (the most precise method based on all available least timeframes) | ||||
| Bars in test | 2978410 | Ticks modelled | 30968777 | Modelling quality | 90.00% |
| Mismatched charts errors | 0 | ||||
| Initial deposit | 10000.00 | Spread | 30 | ||
| Total net profit | 271677917.49 | Gross profit | 423764704.26 | Gross loss | -152086786.78 |
| Profit factor | 2.79 | Expected payoff | 142988.38 | ||
| Absolute drawdown | 4284.99 | Maximal drawdown | 81714936.57 (33.39%) | Relative drawdown | 66.94% (5813948.27) |
| Total trades | 1900 | Short positions (won %) | 867 (75.89%) | Long positions (won %) | 1033 (74.73%) |
| Profit trades (% of total) | 1430 (75.26%) | Loss trades (% of total) | 470 (24.74%) | ||
| Largest | profit trade | 11645719.92 | loss trade | -3135511.88 | |
| Average | profit trade | 296338.95 | loss trade | -323588.91 | |
| Maximum | consecutive wins (profit in money) | 24 (715672.46) | consecutive losses (loss in money) | 6 (-9475.91) | |
| Maximal | consecutive profit (count of wins) | 25709578.57 (7) | consecutive loss (count of losses) | -6806698.19 (5) | |
| Average | consecutive wins | 5 | consecutive losses | 2 | |