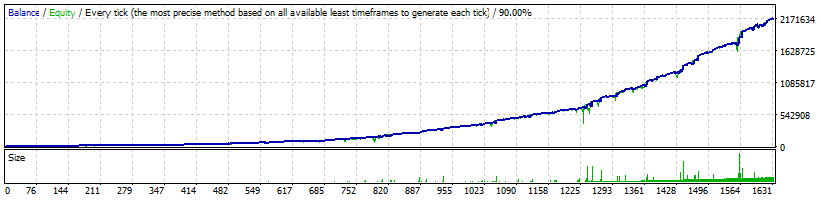
Strategy Tester Report
FXLambda
EGlobal-Demo (Build 1470)
| Symbol | EURUSD (Euro vs US Dollar) | ||||
| Period | 1 Hour (H1) 2018.01.02 00:00 - 2025.12.31 23:47 (2018.01.01 - 2026.01.01) | ||||
| Model | Every tick (the most precise method based on all available least timeframes) | ||||
| Bars in test | 2978565 | Ticks modelled | 29408871 | Modelling quality | 90.00% |
| Mismatched charts errors | 0 | ||||
| Initial deposit | 10000.00 | Spread | 20 | ||
| Total net profit | 2151388.68 | Gross profit | 3305331.65 | Gross loss | -1153942.97 |
| Profit factor | 2.86 | Expected payoff | 1320.68 | ||
| Absolute drawdown | 8696.17 | Maximal drawdown | 523944.72 (73.81%) | Relative drawdown | 90.34% (12193.60) |
| Total trades | 1629 | Short positions (won %) | 655 (76.95%) | Long positions (won %) | 974 (74.95%) |
| Profit trades (% of total) | 1234 (75.75%) | Loss trades (% of total) | 395 (24.25%) | ||
| Largest | profit trade | 104183.12 | loss trade | -23861.84 | |
| Average | profit trade | 2678.55 | loss trade | -2921.37 | |
| Maximum | consecutive wins (profit in money) | 24 (75295.99) | consecutive losses (loss in money) | 6 (-4627.50) | |
| Maximal | consecutive profit (count of wins) | 153885.40 (6) | consecutive loss (count of losses) | -43218.65 (5) | |
| Average | consecutive wins | 5 | consecutive losses | 2 | |